Chat with Agents
Chat with agents and get the most from AI responses.
Interacting with Your Agent
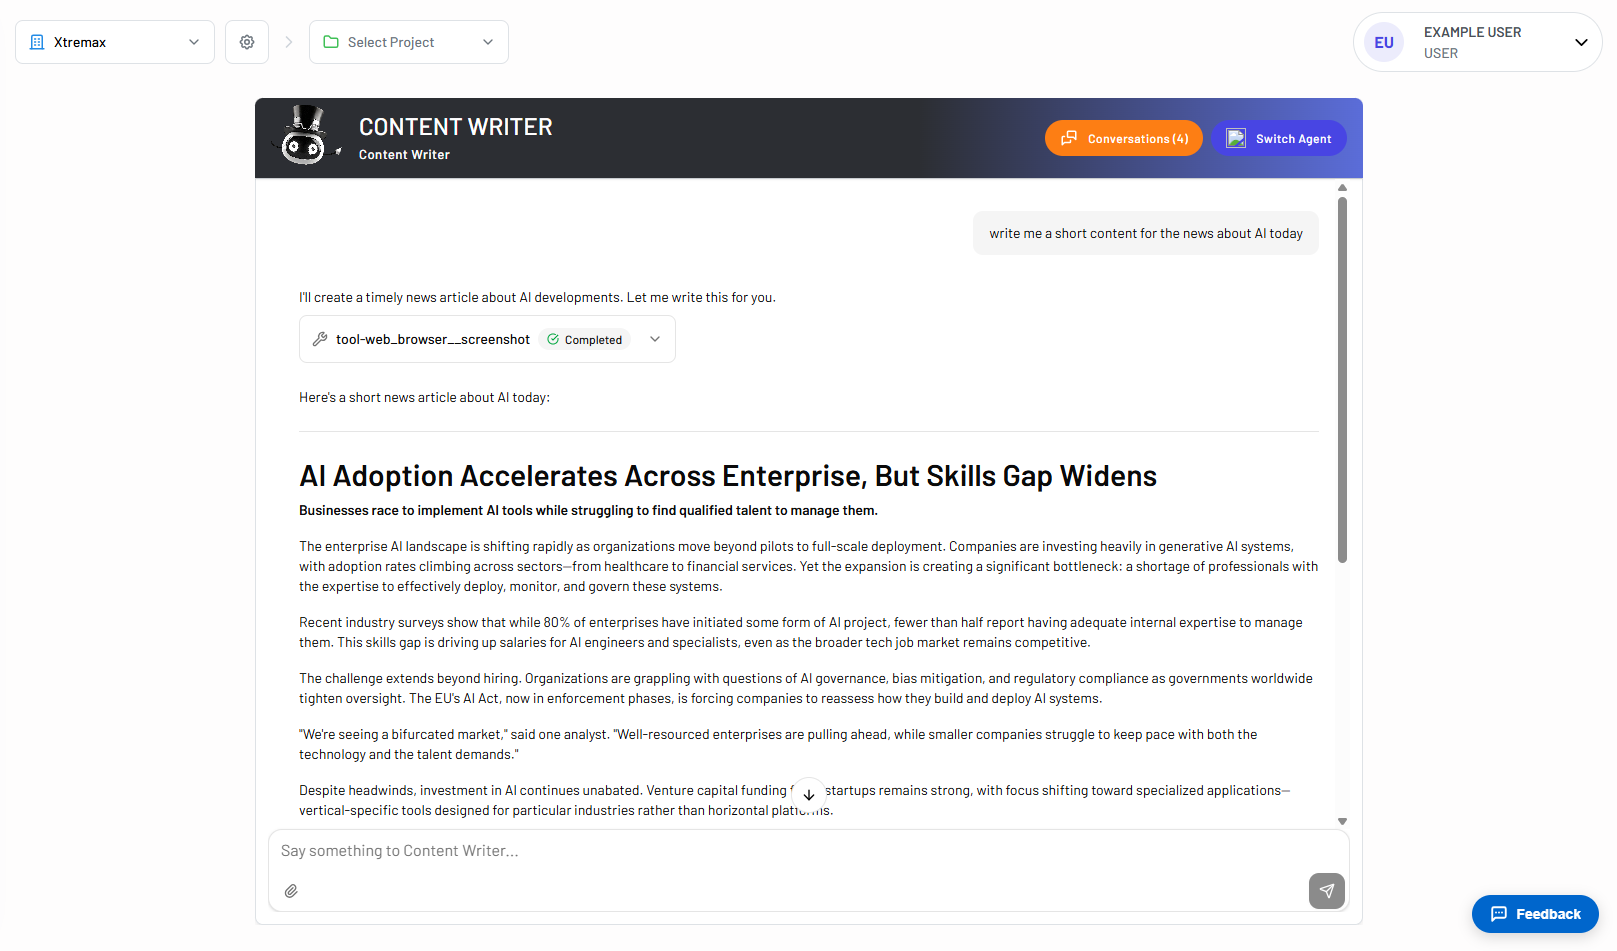
The Dashboard is where you interact with your agents in real time. Select an agent, send prompts, attach files, and review responses, including any tools the agent uses along the way.
Before you start chatting, make sure you have:
- An active organization selected in the header.
- At least one agent available in that organization or project.
- The agent set to Active (inactive agents will not appear in the list).
Selecting an Agent
The agent header at the top of the page shows the currently selected agent’s avatar, name, and role.
- Click Switch Agent to open the agent selector and choose a different agent.
- If no agent is selected, click Select Agent to pick one from the list.
Manage Conversations
Each agent maintains its own conversation history. Click Conversations in the agent header to:
- Start New Conversation → begin a fresh chat without previous message context.
- Switch conversations → resume a previous chat from the recent list.
- Rename, archive, or delete conversations using the three-dot menu on each entry.
Sending Messages to Agents
Type your prompt in the input field at the bottom of the chat window, then press Enter or click the send button.
You can also attach files using the paperclip icon. Supported file types include:
| Type | Formats |
|---|---|
| Images | JPEG, PNG, GIF, WebP |
| Documents | PDF, TXT, Markdown, DOCX |
| Spreadsheets | XLSX, XLS |
Attachments are uploaded before the message is sent. Wait for the upload to complete, then submit your message.
If the agent uses MCP servers that require personal credentials, you may be prompted to configure them before chatting. Click Configure Credentials in the alert banner to set them up.
Understanding AI Responses
Agent responses appear in the chat window below your message. Depending on how the agent is configured, a response may include several types of content.
Text Responses
The agent’s main answer is rendered as formatted text. Long responses can be expanded or collapsed, and you can copy the full text using the copy action that appears when you hover over a message.
Tool Activity
When an agent uses a tool, you will see an inline indicator showing the tool name and its status (for example, Completed). This lets you follow what the agent did to produce its answer, such as searching the web, querying a database, or running a workflow.
Common tool indicators include:
| Indicator | Description |
|---|---|
| Knowledge base search | The agent searched connected knowledge bases for relevant information. |
| Browser / web tools | The agent browsed the web or captured a screenshot. |
| Code interpreter | The agent executed code in a sandboxed environment. |
| Chart renderer | The agent generated a chart or visualization. |
| Document generator | The agent created a PDF, DOCX, or Excel file. |
| Workflow execution | The agent ran an attached workflow and displays the step-by-step trail. |
Reasoning Trail
For responses that involve multiple tool calls, a collapsible reasoning trail appears below the answer. Expand it to see each step the agent took, including tool inputs, outputs, and any errors.
Citations
When the agent retrieves information from a knowledge base, citations may appear below the response showing which documents were referenced. You can expand citations to review the source material.
Streaming and Errors
Responses stream in real time as the agent generates them. If something goes wrong, an error alert appears in the chat with details about what failed. You can retry by sending your message again.
Debug Your Agent
Chocolate Factory provides visibility into how agents generate responses, use tools, and execute reasoning steps. These debugging features help you understand agent behavior and troubleshoot unexpected results.
Steps & Reasoning
When an agent uses tools, the chat interface displays tool activity inline with the response.
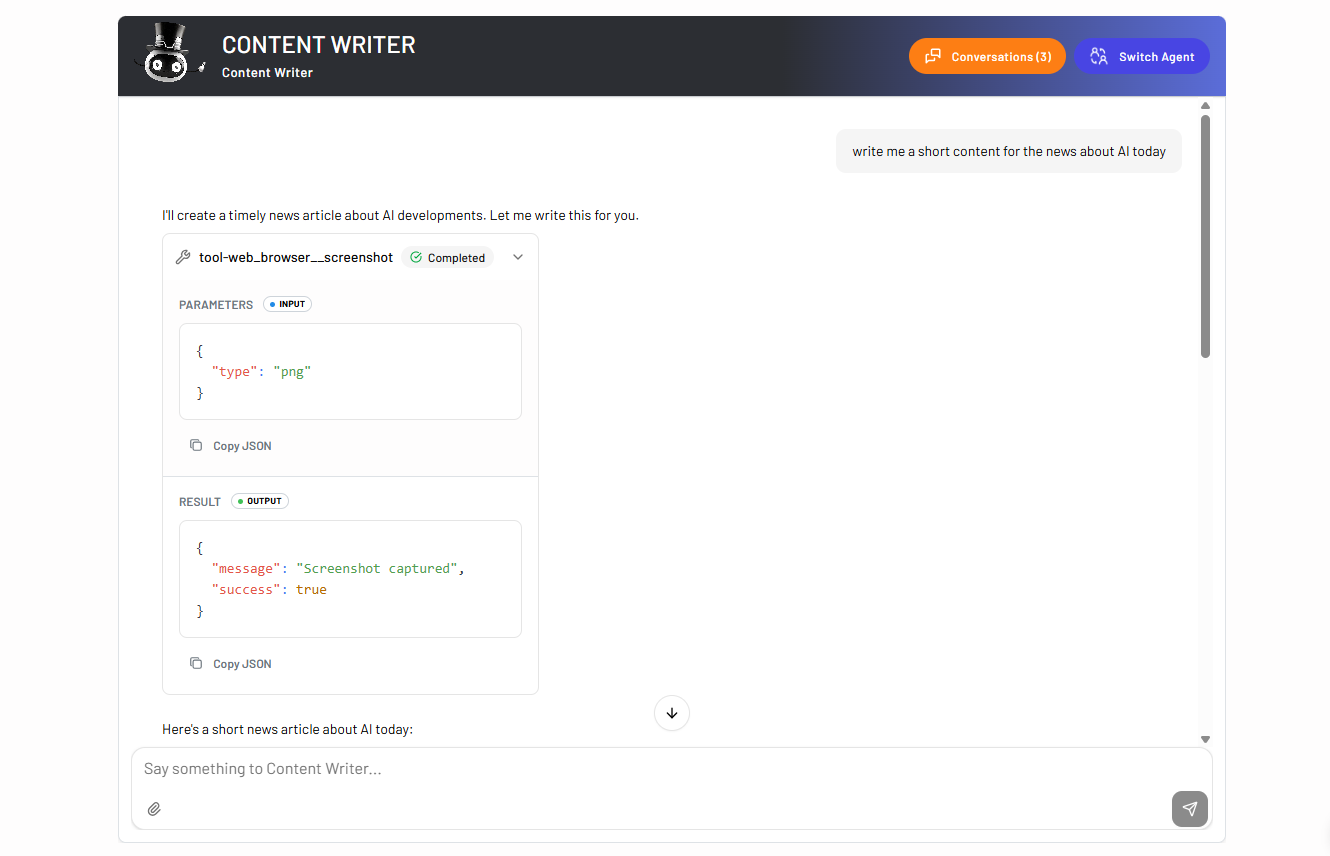
You can review:
- Which tools were called
- The status of each tool execution
- The order in which tools were used
- Whether a tool completed successfully or failed
For more complex tasks, expand the reasoning trail to review the sequence of actions the agent performed before producing the final answer.
Observability
For deeper debugging, open the observability view next to bubble chat from the conversation to inspect the complete execution trace.
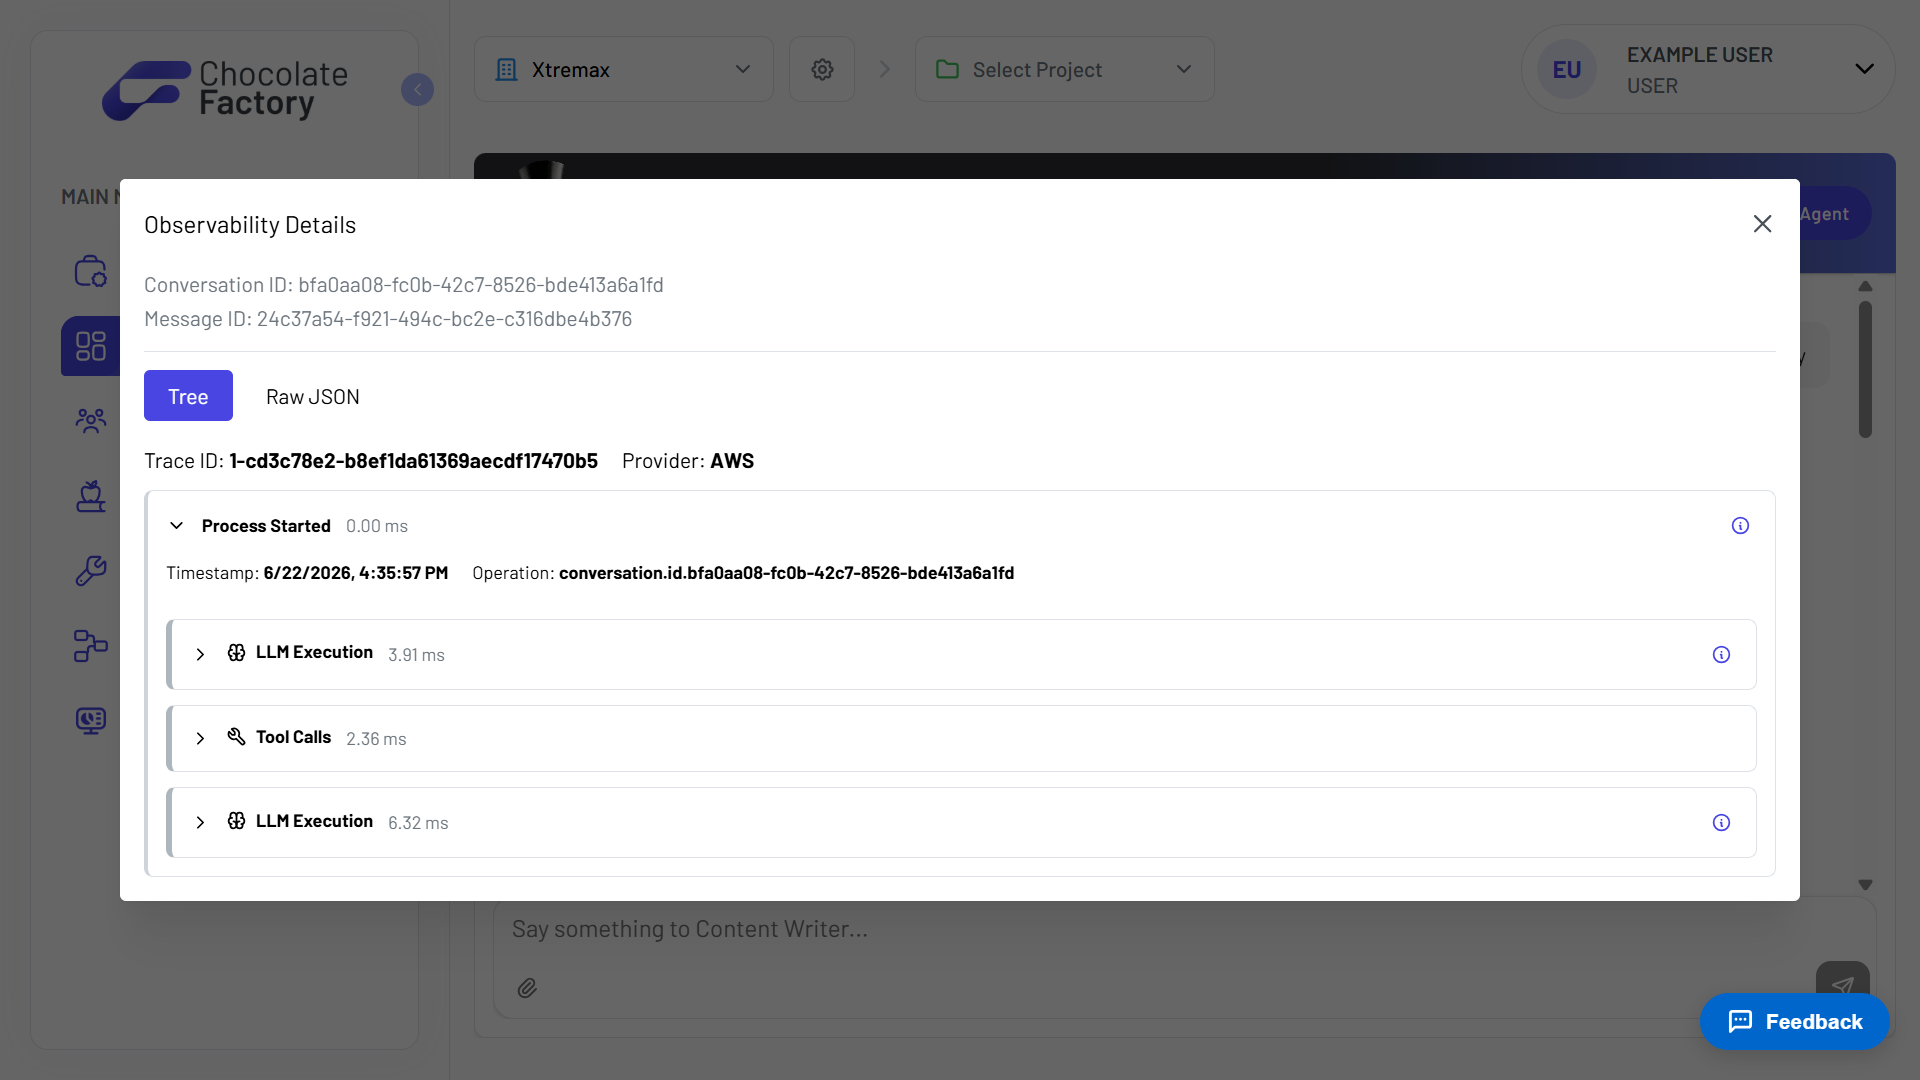
The observability view provides:
- Conversation ID and Message ID for traceability
- Complete execution traces for each request
- Individual LLM Execution steps
- Detailed Tool Calls and execution timing
- Provider information
- Raw JSON execution data for advanced troubleshooting
Use observability traces to identify failed tool calls, review execution timing, and understand how the agent reached its final response.
Writing Effective Prompts
- State your goal clearly, say exactly what you want instead of asking vaguely.
- Provide context, include audience, constraints, or background the agent needs.
- Specify the output format, such as bullet points, table, tone, word count, or sections to include.
- Use attachments (e.g., files, pictures, documents, etc.) when needed and tell the agent what to do with them.
- Break down complex tasks into smaller steps when a single prompt is too broad.
- Follow up to refine the response instead of starting over.
- Review outputs before using them for business-critical, legal, or compliance decisions.