Monitoring
Track token usage, execution logs, and observability traces across your organization.
Overview
The Monitoring page gives organization administrators visibility into how agents are used across the organization. Navigate Monitoring from the main menu to review activity for the selected organization, consisting of 3 tabs :
- Token Usage → track how many tokens your organization consumes, broken down by user, agent, or project.
- Execution Logs → browse agent conversations, inspect message history, and review individual execution runs.
- Observability → explore agent activity at a higher level, drill into distributed traces for individual prompts, and pinpoint where to adjust your prompt accordingly.
Monitoring is available to Organization Owners and Admins only.
Token Usage
The Token Usage tab helps you understand how much your organization is spending on AI model consumption. Use it to monitor overall usage trends and identify which users, agents, or projects are driving the highest token volume.
- Total Tokens → combined input and output tokens across all agent runs.
- Input Tokens → tokens sent to the model (prompts, context, and tool inputs).
- Output Tokens → tokens generated in agent responses.
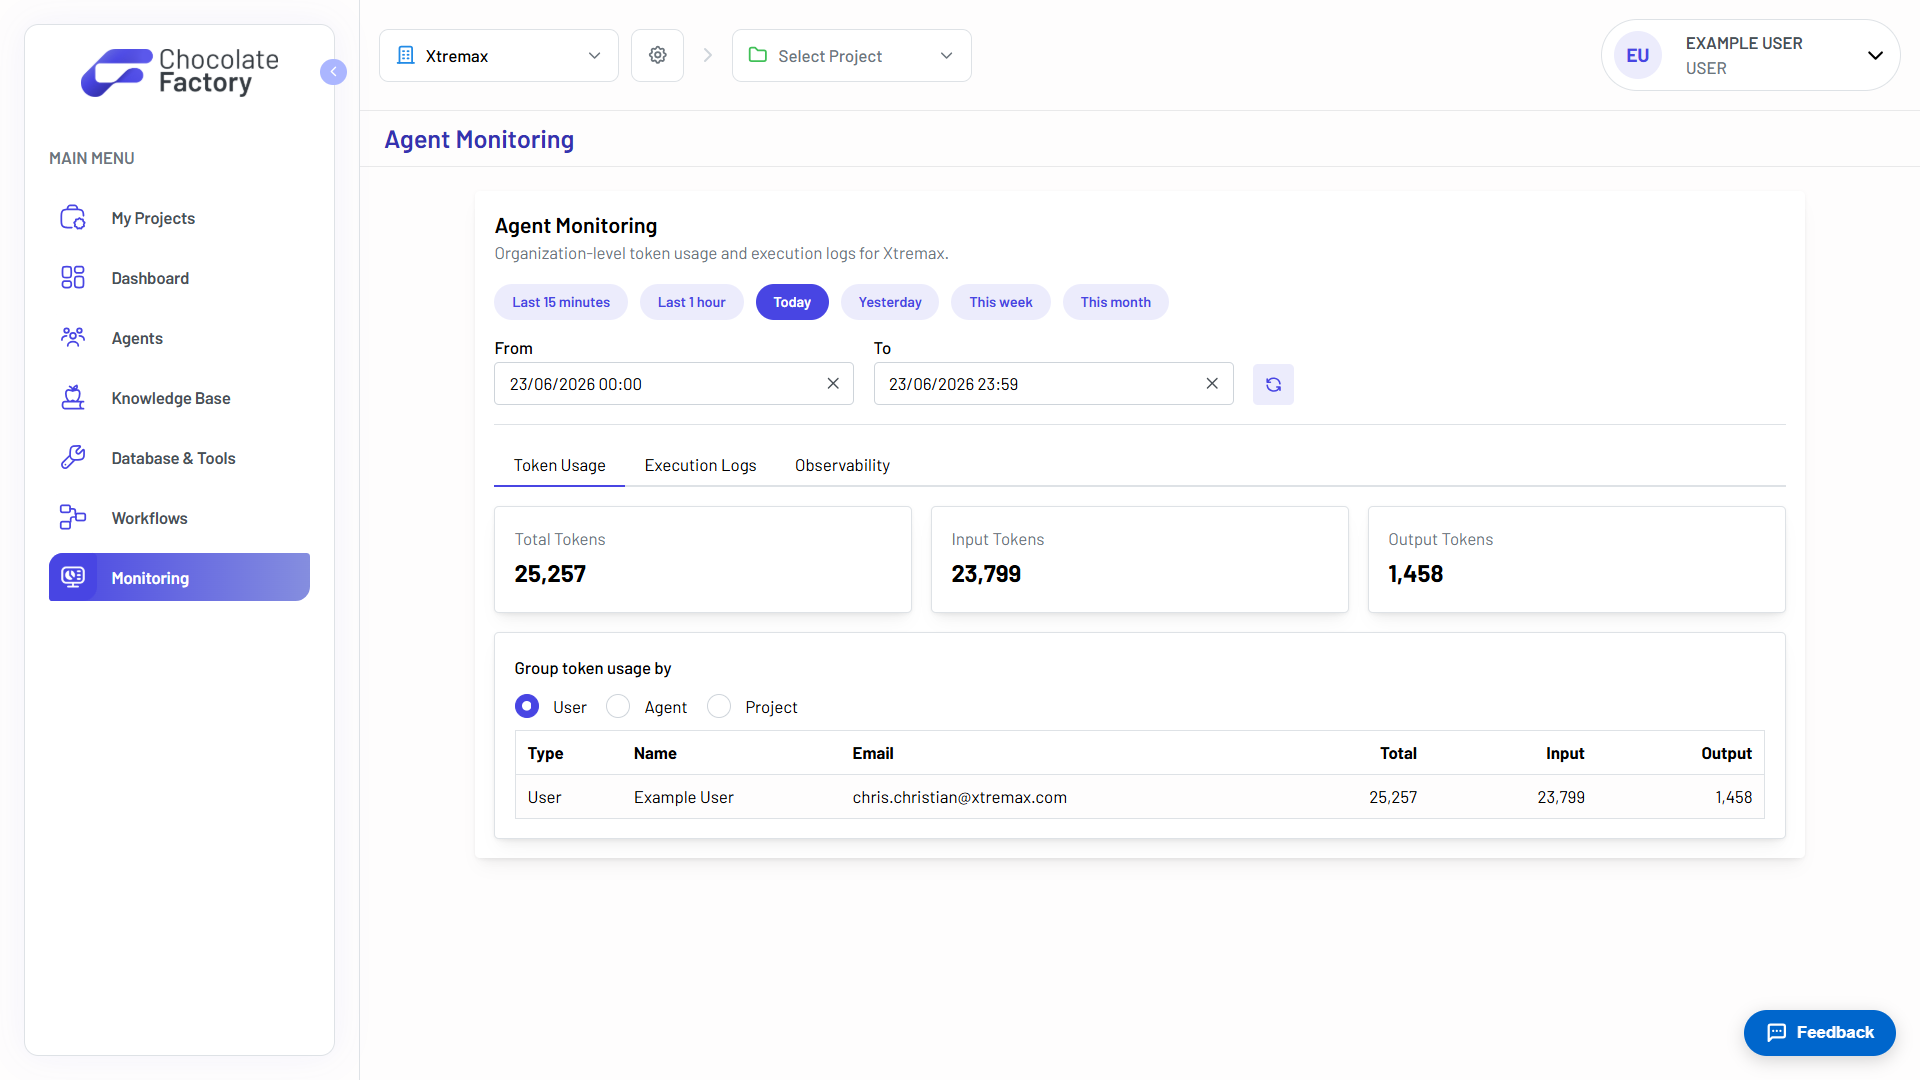
Each breakdown table shows total, input, and output token counts so you can identify heavy users, high-traffic agents, or projects driving the most consumption.
Execution Logs
The Execution Logs tab provides an audit trail of agent conversations and their runs. Use it to review what users asked, how agents responded, and which tools were invoked - useful for troubleshooting errors or verifying agent behavior.
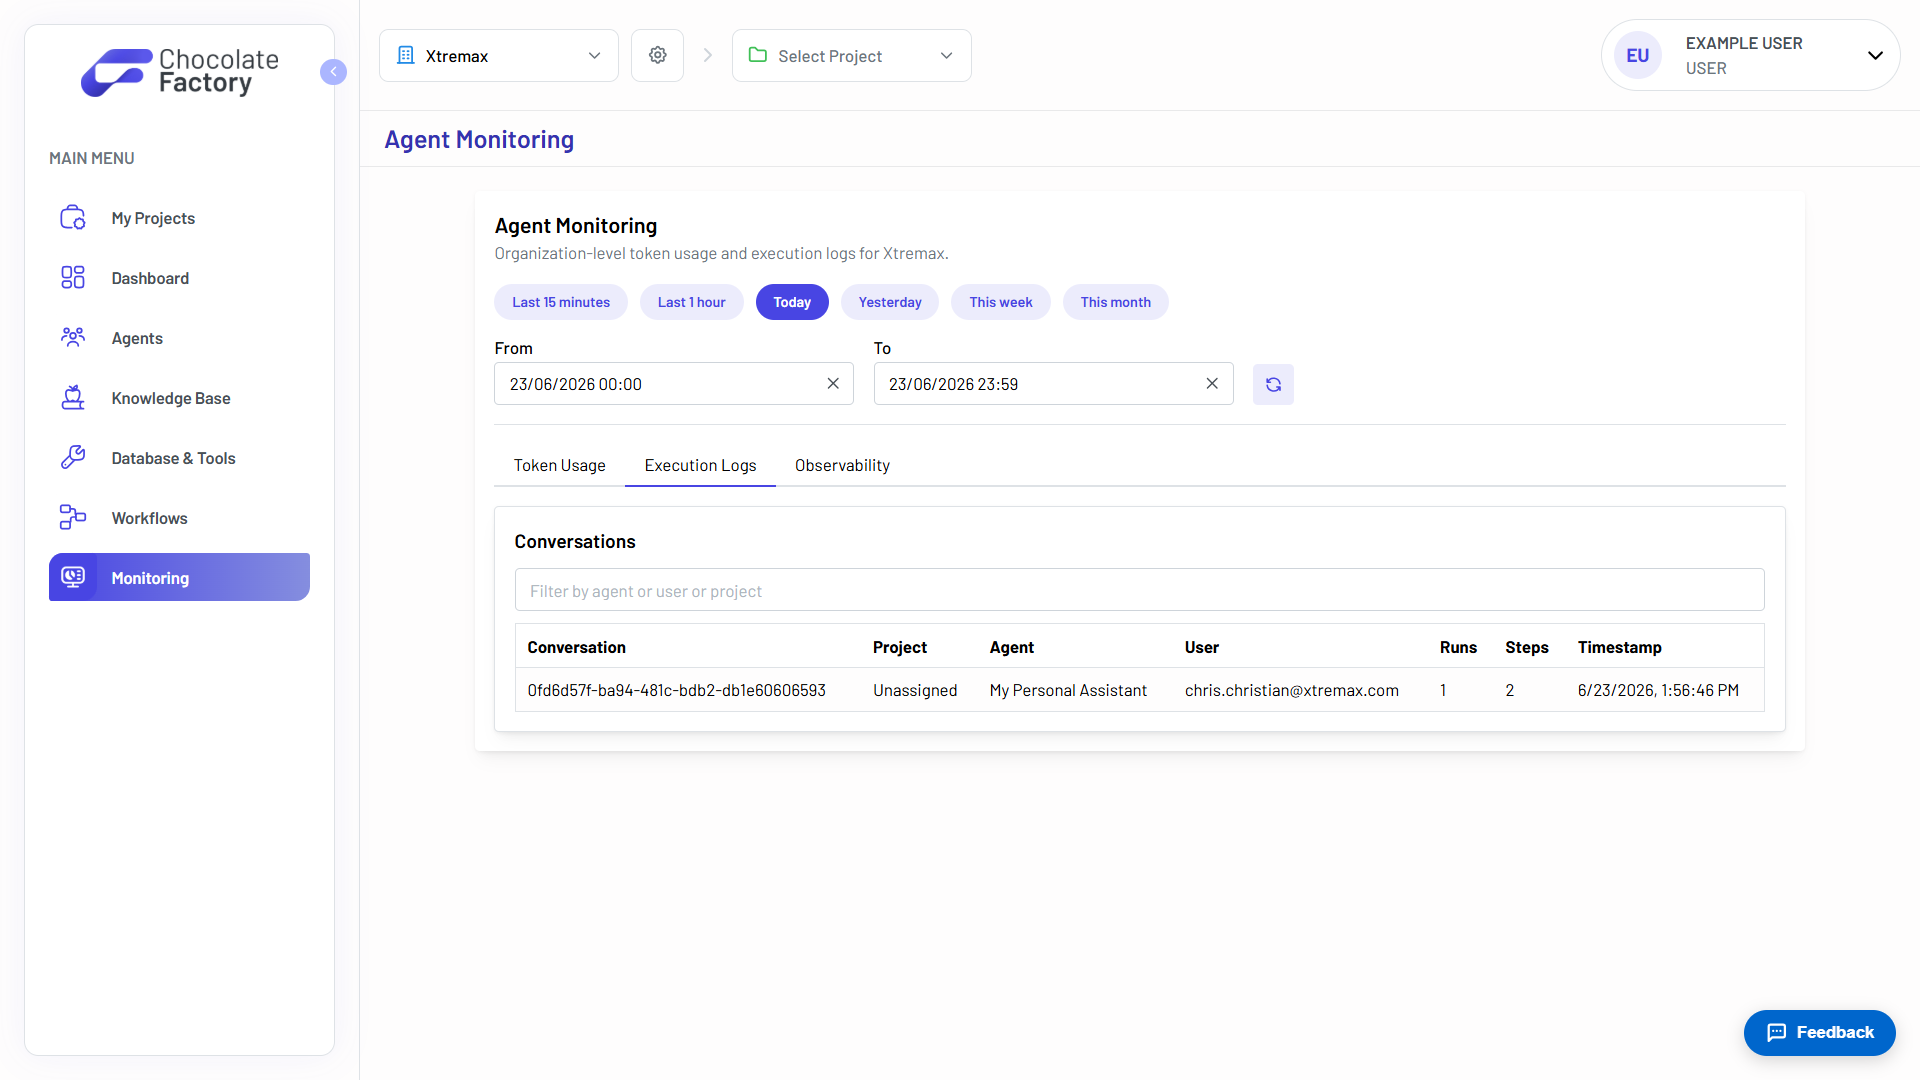
Use the filter field to search by agent, user, or project, then click a conversation row to open its detail view.
Conversation Detail
The conversation detail modal shows the full message history for that conversation. Each message displays its role, sequence number, timestamp, and content, including any tool calls the agent made during the response.
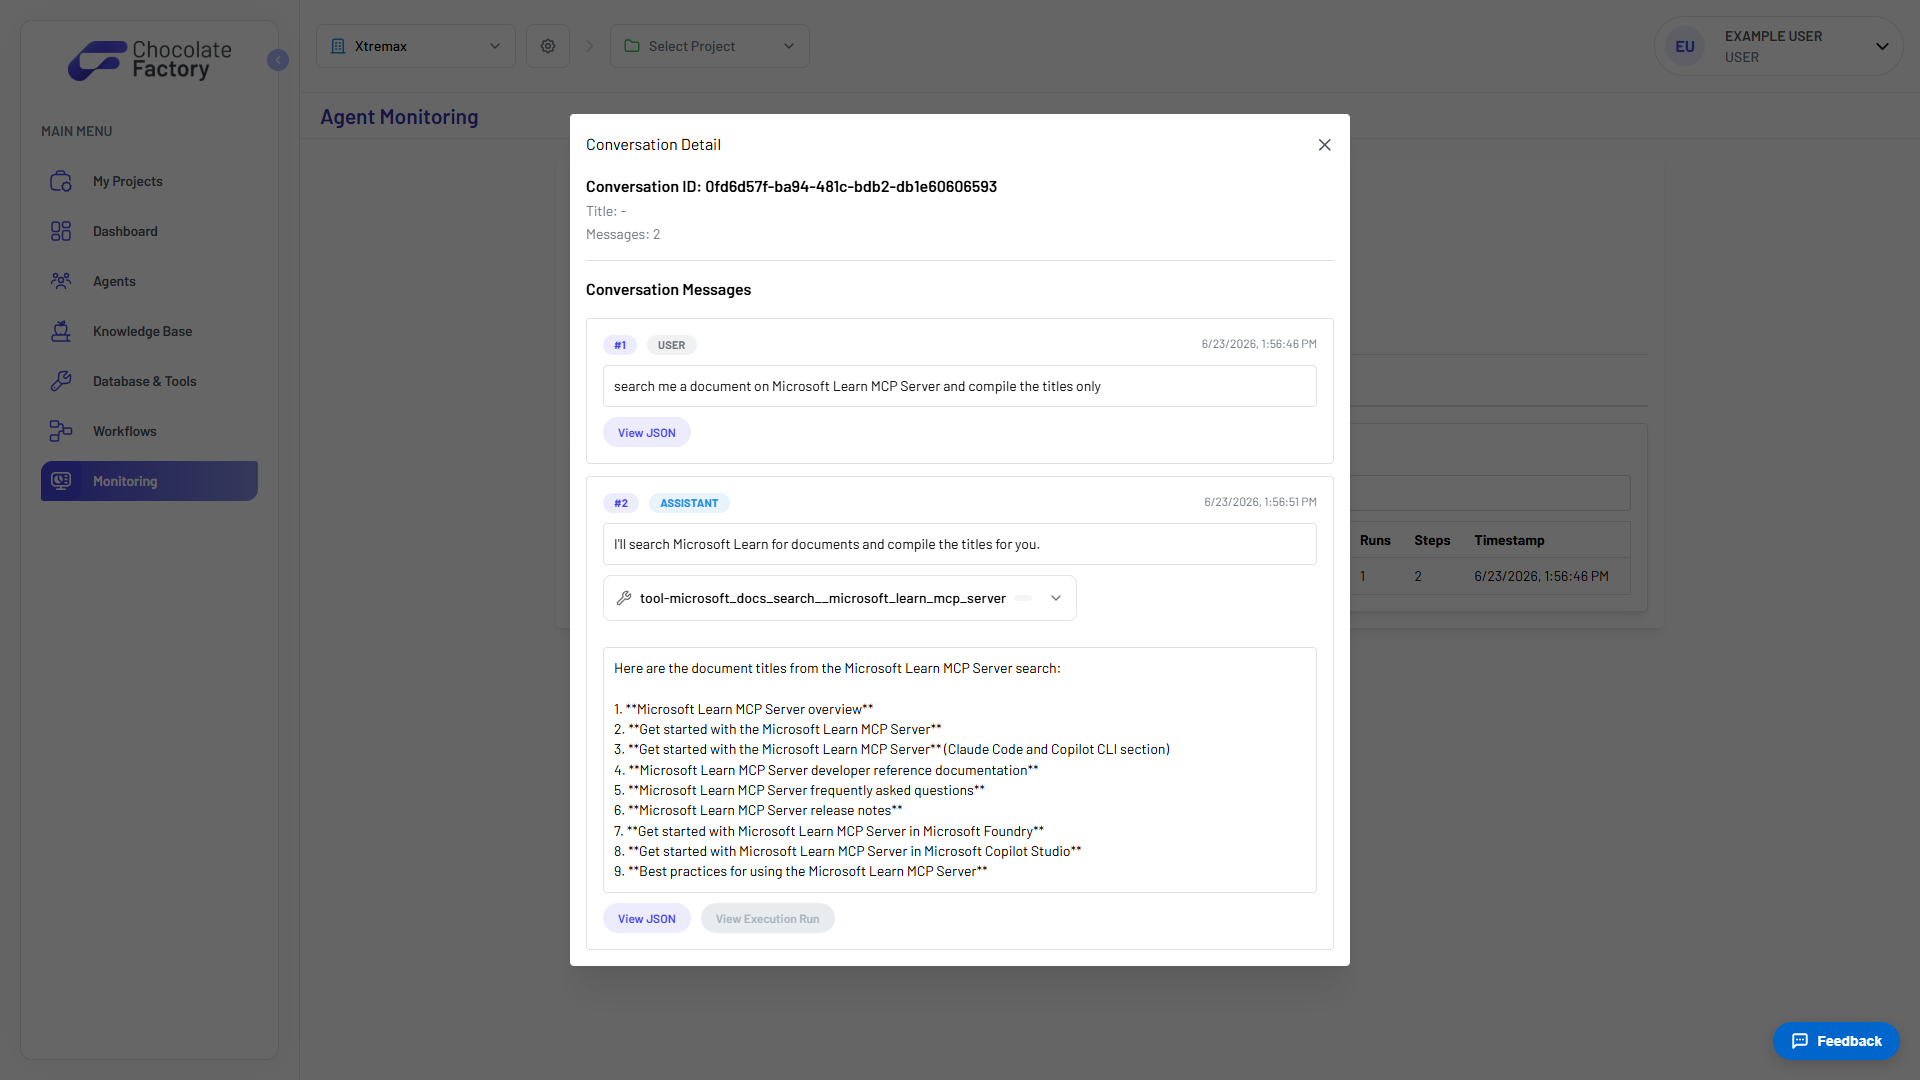
From the conversation detail you can:
- View JSON → inspect the raw message payload.
- View Execution Run → open run-level details for an assistant message, including status, model, token count, error message, and the request/response message exchange.
Observability
The Observability tab is designed for deeper debugging of agent performance. It lets you trace how a single prompt flows through the system, from the initial request through LLM calls and tool invocations - so you can pinpoint slow steps, failed tool calls, or unclear instructions and adjust your prompt accordingly.
By Agent
Group observability data by Agent to see which agents are most active. The table shows each agent’s name, model, and total conversation count.
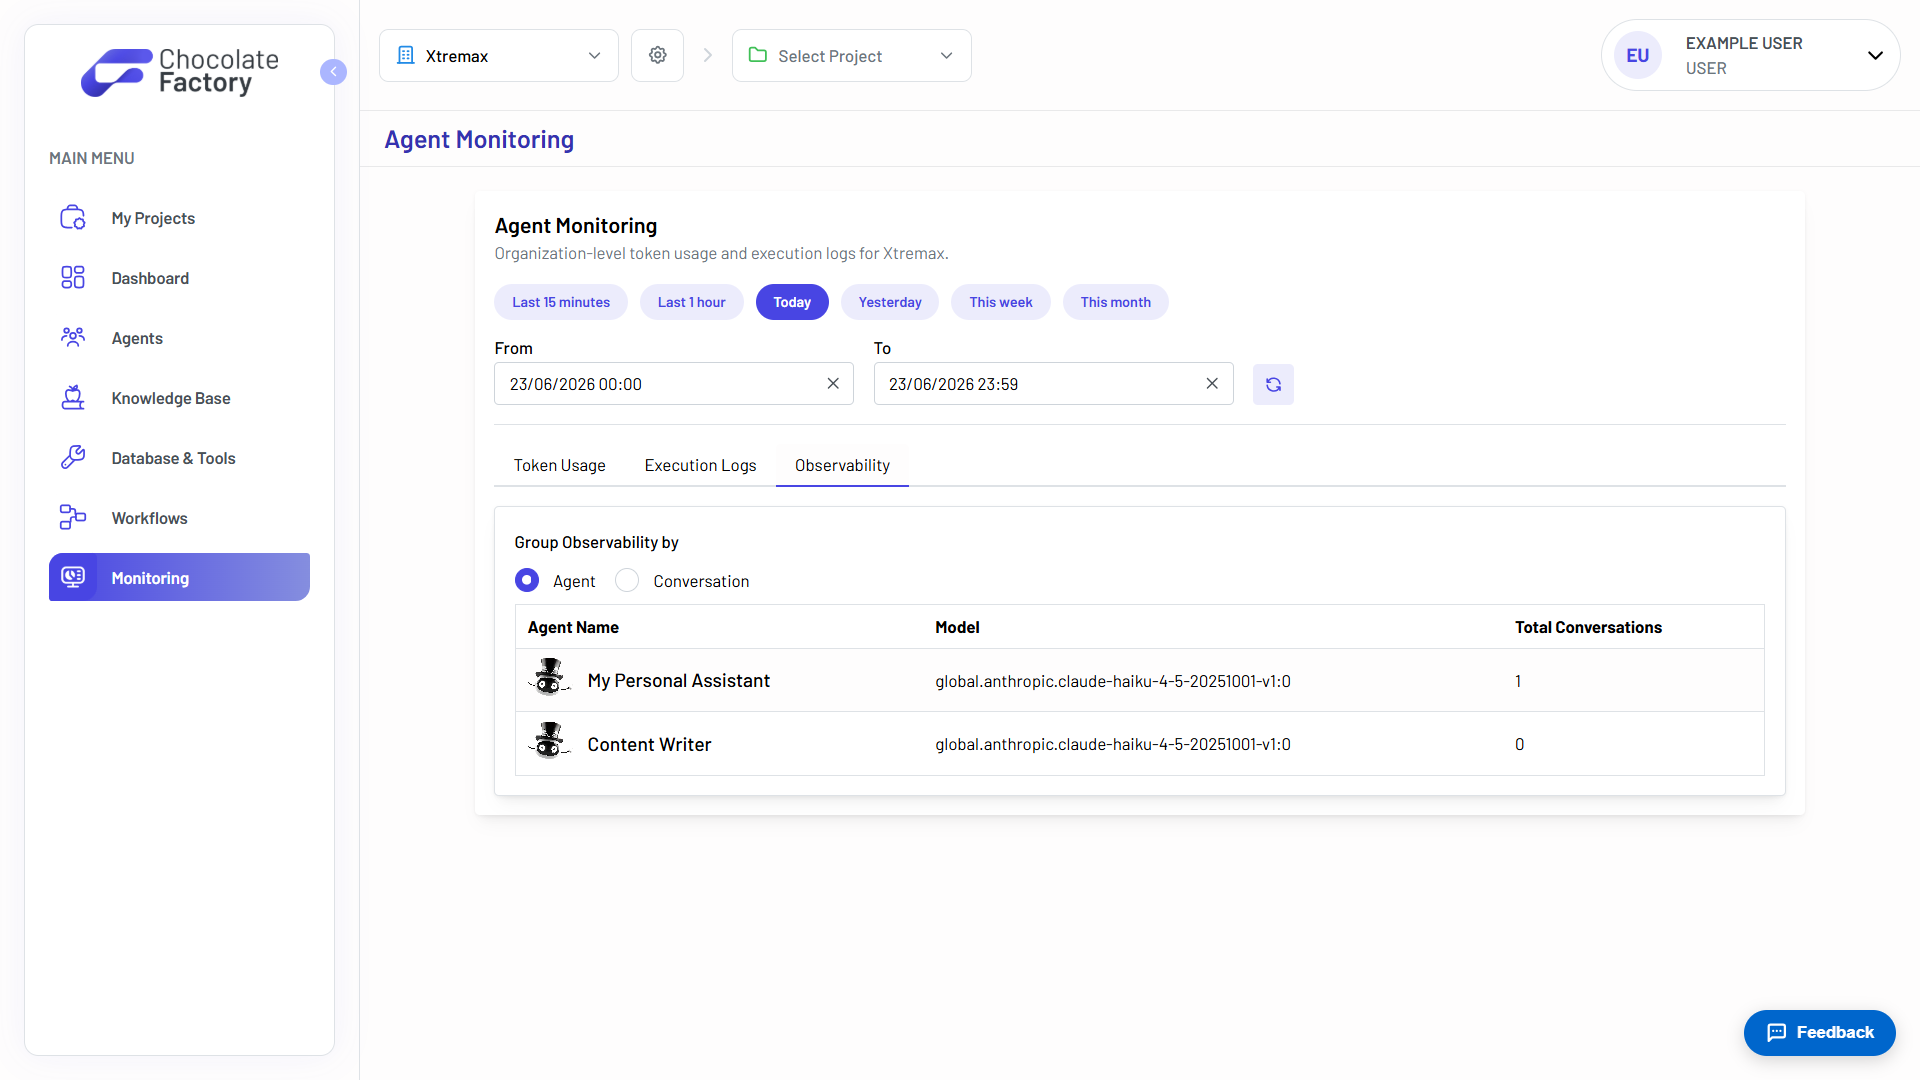
Click an agent row to switch to the conversation view filtered to that agent.
By Conversation
Group observability data by Conversation to browse individual chat sessions. Use the filter field to search by agent name, user, or conversation ID.
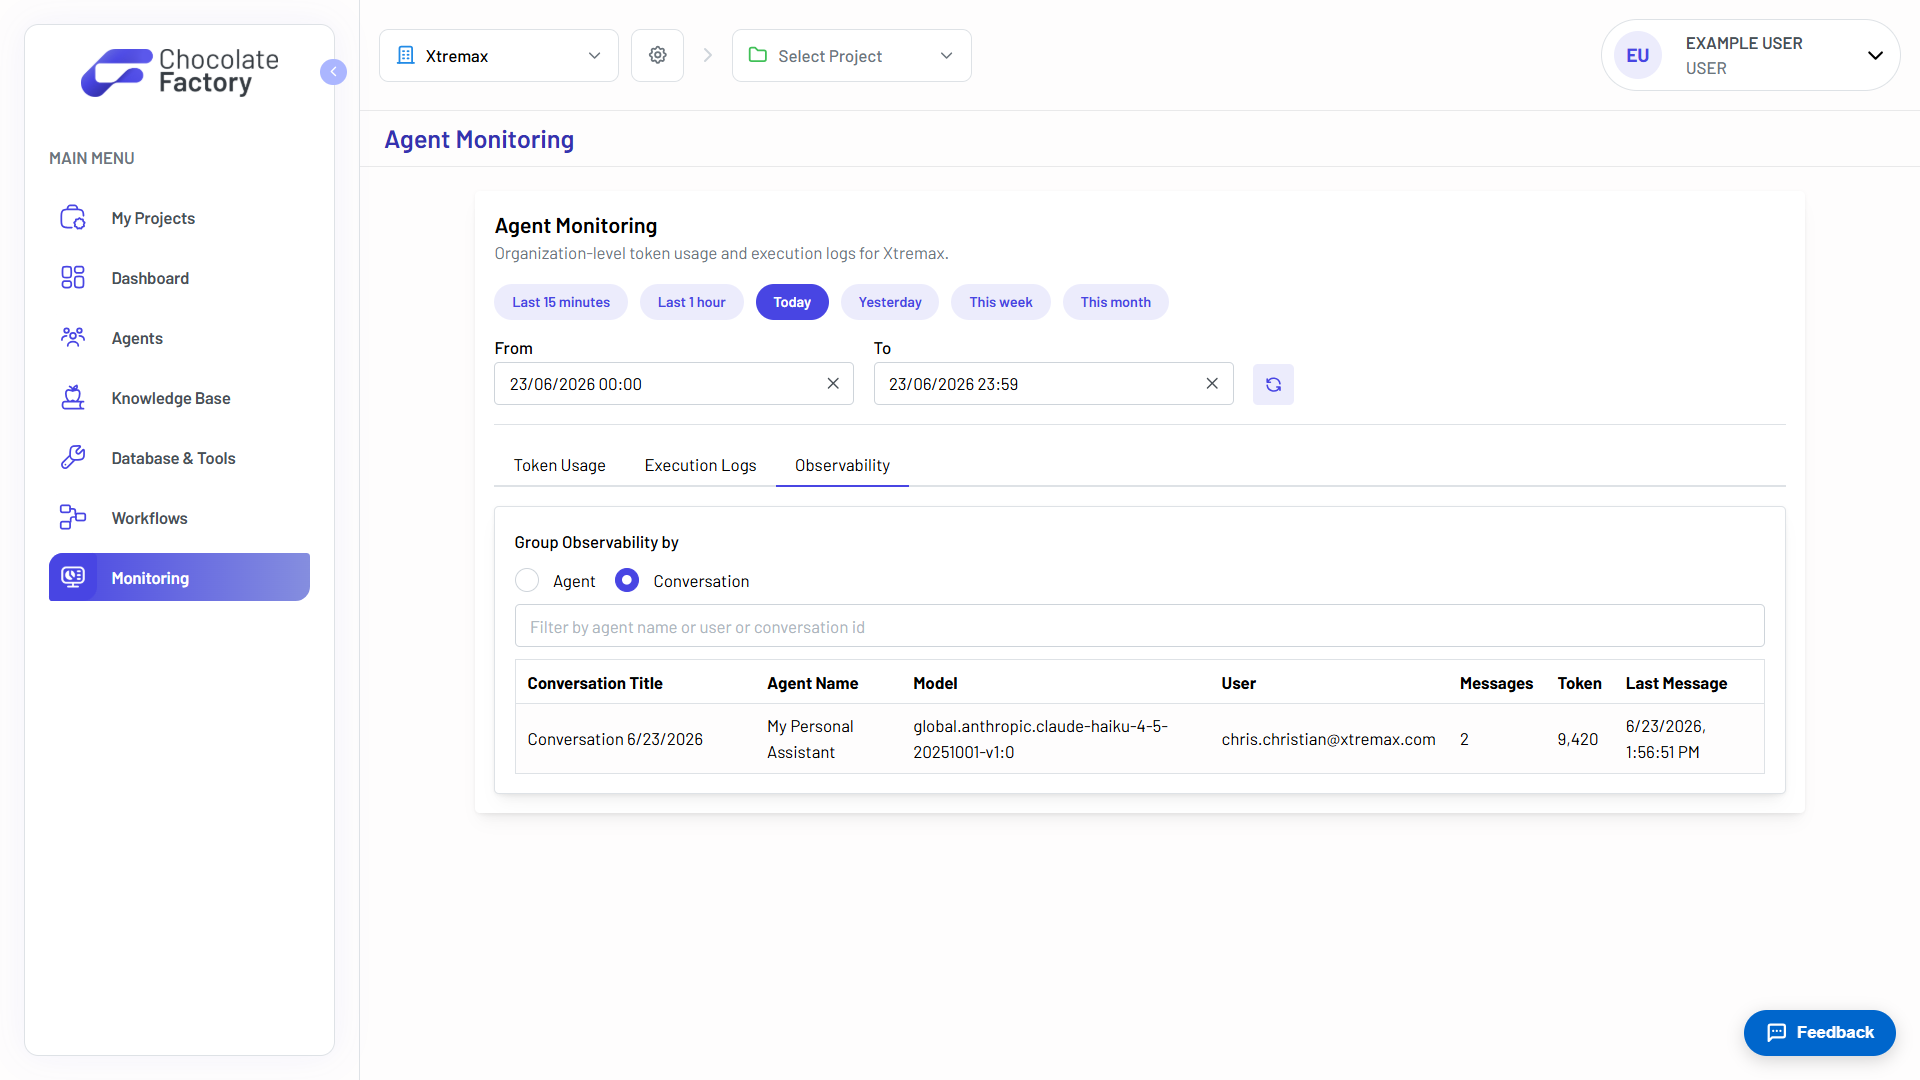
The table shows the conversation title, agent, model, user, message count, token usage, and last message timestamp. Click a row to open the conversation detail.
Conversation Detail and Traces
The conversation detail view lists each user prompt in the conversation. For every prompt you can open a View Trace button to inspect the full observability trace for that execution.
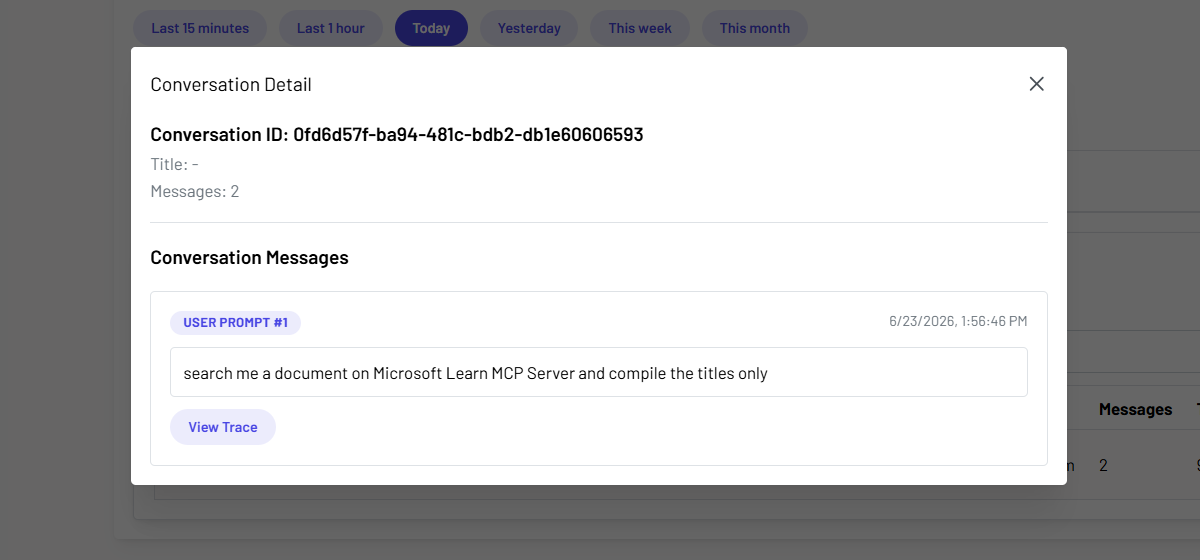
The trace viewer shows a hierarchical span tree for the agent run, including LLM calls, tool invocations, and timing information. Expand spans to review inputs, outputs, metadata, and logs for each step.
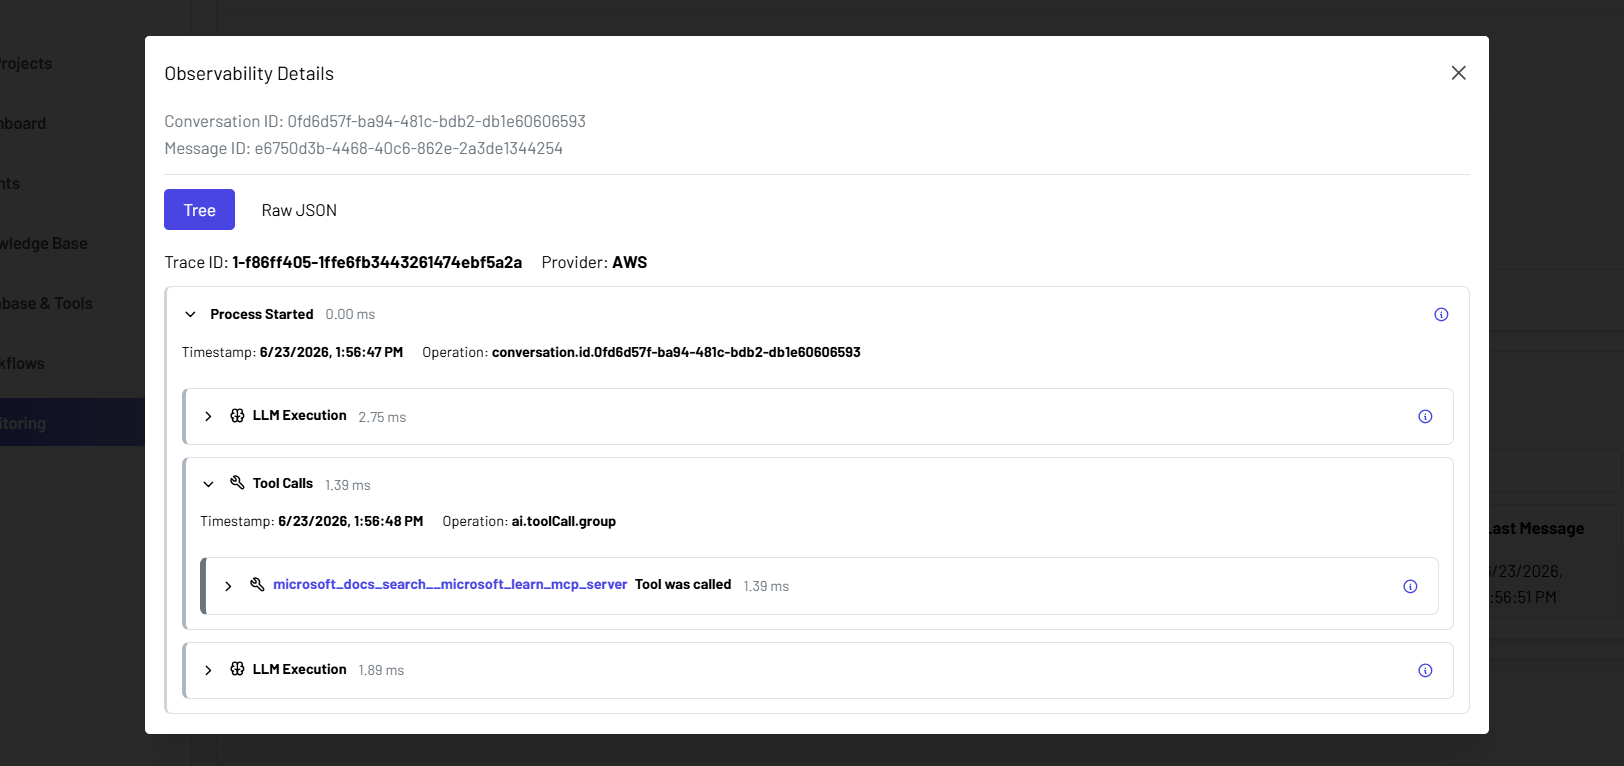
Use traces to diagnose slow responses, failed tool calls, or unexpected agent behavior, then refine your agent configuration or prompt based on what you find.